Byte # 64: REITs Part II - Own Real Estate. Collect Income. But Know What to Look For.
Dear Readers,
Welcome to this week’s byte which is a continuation of the byte from last week. Last week we started with the foundation: what a REIT is, why investors love them, and the different types you can own.
Today, we’ll dig into the real meat - the financial metrics that matter most when evaluating them.
So, let’s dive in and see if it makes sense to generate real estate income without owning a single physical property.
REITs vs Ordinary Stocks
Last week, I mentioned REITs are large, liquid, diversified, and built to distribute income, which is exactly why they deserve attention in any long‑term portfolio. However, before we dig deeper, let’s look into their historical performance vs equities in general.
According to data from NAREIT (National Association of Real Estate Investment Trusts), REITs have been better investments than stocks over the last 25- and 50- year periods (as measured by total return). However, stocks have led in the most recent 1-, 5-, 10-year periods. The last decade has been challenging for real estate due to the pandemic structural shifts, a massive surge in interest rates, and the tech-driven rally in the S&P 500.
However, 2026 has been a run-up year so far after many down years partly due to the outperformance of data center REITs and low valuation as the REITs were oversold. Infact REIT relative outperformance in early 2026 has been the strongest since 2006.
Here’s a quick performance snapshot of REITs in 2026 YTD vs 2025.
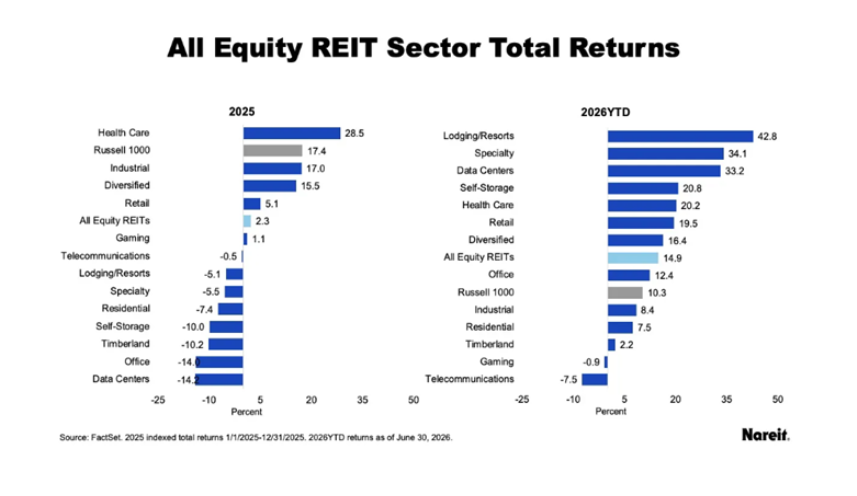
So, why REITs if they have been a laggard: REITs are a narrow part of the total market and provide significant diversification to the portfolio. They are a fantastic income provider as their average dividend payout is much higher than regular dividend stocks which in turn helps you mitigate inflation.
Understanding Interest Rates and REITs
Understanding the relationship between interest rates and REITs is a very important aspect of getting started with REIT investing.
REITs are essentially giant real estate businesses, their stock prices are closely tied to the movement of interest rates. When interest rates shift, it acts like a giant seesaw for REIT stock prices.
Here is exactly how that relationship works:
1. The Short-Term Seesaw (Rates Up, REITs Down)
When the Federal Reserve raises interest rates, it sends an immediate shock wave through the REIT market. This happens for two main reasons:
The Dividend Competition: Investors often buy REITs because they pay high dividends. If a REIT pays a 5% dividend, that looks amazing when a safe government bond pays only 1%. But if interest rates spike and safe government bonds start paying 5%, investors will dump their "risky" REITs to buy the "safe" bonds. To attract buyers back, the REITs stock price has to drop so its dividend yield looks higher and more competitive.
The Cost of Debt: Just like a regular homebuyer, a REIT relies heavily on mortgages and bank loans to buy properties. When interest rates shoot up, borrowing money becomes incredibly expensive. When old loans expire and need to be renewed at higher rates, it eats into the REIT's profits, leaving less cash available for investors.
Because of this, the best time to buy REITs is usually when interest rates are peaking and high. That is when panic is at its highest, REIT stock prices are at their lowest, and you can lock in the highest possible dividend yields.
2. The Long-Term Rebound (The Seesaw evens out)
While a sudden spike in interest rates hurts REITs immediately, the relationship changes if you hold onto them for the long term (5 years or more).
Interest rates usually rise because the economy is booming and growing. A strong economy means people have jobs, businesses are expanding, and the demand for real estate goes up. This gives REITs "pricing power." They can easily raise rent prices on their tenants to keep up with inflation.
Over time, this extra rent money offsets the higher borrowing costs, profits recover, and the REIT stock price starts moving back up.
Understanding current interest rate scenario
As of August 17, 2026, the key short-term interest rates are:
The Federal Funds Rate: The target range sits at 3.50% to 3.75%, with the daily effective rate hovering at 3.63%.
3-Month U.S. Treasury Bill: Yielding right around 3.80% (with constant maturity at 3.87%).
What This Means for the "REIT Strategy"
Connecting this to our previous discussion:
Rates Have Levelled Off: Short-term rates have dropped significantly from their peak years ago (when they were well over 5%). They are currently holding steady in the mid-3% range.
The "Dividend Competition" Has Softened: With safe government options like a 3-month T-Bill paying 3.80%, it is now much easier for high-quality REITs (which often yield 4.5% to 6%) to look highly attractive to income investors again.
As a result, we are seeing a significant outperformance of REITs in 2026 YTD.
Last year, in few of my bytes I mentioned investing in Realty Income, also known as "The Monthly Dividend Company. It has increased its dividend for 30 consecutive years.” It yielded ~5.6% late last year and in YTD has jumped +10.71% in value. So, as an investor, you are able to capture not only the upside in price but also the dividend, thereby locking in a ~14.7% return YTD.
Follow this link to read more about Realty Income: “Realty Income Earnings: Stable Earnings Lead to Fitch Ratings Upgrade to 'A' With Stable Outlook”
How to Protect Yourself
Timing interest rates perfectly is incredibly difficult, and betting on the wrong REIT can lead to heavy losses. If you want to use this to your advantage, use these key metrics to analyze the REITs:
1. What the business is about: Use the “business” section of Form 10-K or 10-Q from the Investor Relations page of the REITs website to learn what they do. For a quick snapshot, you can use this link https://www.reit.com/investing/reit-directory to get started.
2. Gross vs Net Lease: In a gross lease, the tenant pays a single, flat rent amount, while the landlord covers all property expenses like taxes, insurance, and maintenance. In a net lease, the tenant pays the rent but takes on some or all of the property expenses in addition to that rent.
Always look for a Triple Net Lease (NNN), where tenants pay the rent, taxes, insurance and maintenance. Realty Income is the best-in-class triple net lease operator. This information can be easily located on 10-K/10-Q form.
3. Funds From Operations (FFO) : It is the actual cash profit that a real estate company or REIT makes from running its properties.
Normal corporate accounting forces companies to subtract depreciation (the theoretical drop in value of assets over time as they get older). For a tech company with laptops and trucks, that makes sense because tech wears out. But for a real estate company, buildings usually go up in value over time, not down.
If a REIT uses normal accounting, depreciation makes their profits look artificially low on paper. FFO fixes this mistake with a simple formula:
FFO = Net Income + Depreciation + Amortization + Losses on Sales of Asset - Gains on Sales of Assets - Interest Income
The key idea is that ordinary net income can understate a REIT’s operating performance because accounting depreciation reduces earnings even when real estate may retain or increase its value. FFO therefore offers a more useful operating measure for REIT analysis - investors look at the Price-to-FFO ratio instead of the traditional Price-to-Earnings (P/E) ratio to judge if a REIT stock is cheap or expensive.
Using Realty Income as an example : Its current price is $62.40 and FFO ~$4.36/share. So it’s P/FFO = 14.38
To put that multiple into perspective, the market has historically valued Realty Income at a much higher premium:
10-Year Average Ratio: Historically, its average P/FFO multiple sits right around 17.7x to 18.0x.
The Valuation Discount: At today's current multiple of ~14.4x, the stock is trading at roughly a 18% to 20% discount relative to its longer-term historical fair value
The data indicates that while Realty Income's stock price has rebounded nicely year-to-date, the valuation remains historically cheap. If interest rates continue to fall or stay stable, there is still mathematical room for the P/FFO multiple to expand back toward its historical average of ~18x.
Important: FFO should not be confused with cash flow from operations, which is found on the company's statement of cash flows. Furthermore, FFO is not based upon Generally Accepted Accounting Principles (GAAP); FFO originates from NAREIT.
4. Adjusted FFO (AFFO) - For a more conservative view, investors use AFFO. While FFO is a great starting point, it has one major flaw: it ignores the real-world costs required to keep buildings running. AFFO fixes this by taking FFO and making these crucial real-world adjustments:
Subtracts Routine Maintenance (CapEx): Even if a building is increasing in value, the landlord still has to occasionally pay for a new roof, fix an HVAC system, or repave a parking lot. This is called Capital Expenditures (CapEx). This is real cash leaving the company, so AFFO subtracts it.
Subtracts Tenant Improvements and Leasing Fees: When a tenant's lease ends, the REIT often has to pay to remodel the office space for the next tenant and pay a broker fee to find them. This costs cash, so AFFO subtracts it.
Adjusts for "Straight-Line" Rents: If a tenant has a 10-year lease where rent steps up slightly every year, standard accounting averages that total revenue out evenly over 10 years. AFFO removes this accounting math and replaces it with the exact amount of cash collected that specific month
It is the absolute closest thing to the actual "free cash flow" a REIT has left over to pay its dividends. Sometimes it is also referred to as Cash Available for Distribution (CAD).
Both of these metrics can be found in Form 10-K/10-Q and also referred to by the management in their earnings call. For e.g. in the Earnings Call Insights of Realty Income (O) Q2 2026:
CEO Sumit Roy said, "AFFO per share grew 3.8% to $1.09 during the quarter" and added, "This momentum supports a $0.02 increase in our full year AFFO per share guidance midpoint to a new range of $4.44 to $4.45."
CFO Jonathan Pong said, "we are increasing our full year AFFO per share guidance range to $4.44 to $4.45"
5. AFFO Payout ratio or dividend-payout ratio : When evaluating if a REIT's dividend is safe from being cut, you should look at the AFFO Payout Ratio.
AFFO Payout Ratio = Dividend Per Share / AFFO Per share
Continuing with the e.g. of Realty Income : its div rate is $3.25/share, i.e. the payout ratio is ~73% ($3.25/$4.45)
This is a very safe payout ratio. Anything above 95% should raise a red flag.
So, for Realty Income - by paying out only ~73% of its real cash profits to cover the monthly dividend, Realty Income keeps roughly 27 cents of every dollar. They use this buffer to buy new properties, fund property maintenance, and protect your dividend from ever being cut—even if a major tenant goes bankrupt.
6. Net Debt-to-EBITDAre Ratio : This is the absolute key metric used to determine the debt level and financial safety of a REIT. In simple terms, this ratio answers one question: "How many years of cash profit would it take for this REIT to completely pay off all its debt?"
Net Debt : The REIT's total debt minus any cash they have sitting in the bank.
EBITDAre (Earnings Before Interest, Taxes, Depreciation, and Amortization for Real Estate) : A real estate version of EBITDA, adding back interest, taxes, depreciation, and amortization to net income. It ignores debt: It completely adds back all interest payments. It tells you how much cash the real estate portfolio generates before paying back the banks or bondholders.
A lower ratio generally under 6x is a sign that the REIT is operating within a manageable range of leverage.
For context, Realty Income is currently very safe, sitting at a highly disciplined 5.4x.
7. Weighted Average Term to Maturity: This tells you the average number of years before the REIT's current debt expires and needs to be renegotiated. A longer term (e.g., 5 to 7+ years) means the REIT is protected from high interest rates because their cheap debt is locked in for a long time.
Both of the debt related metrics can be usually found in REIT’s financial publications/investor presentations. Here’s a snip from Realty Income’s presentation:
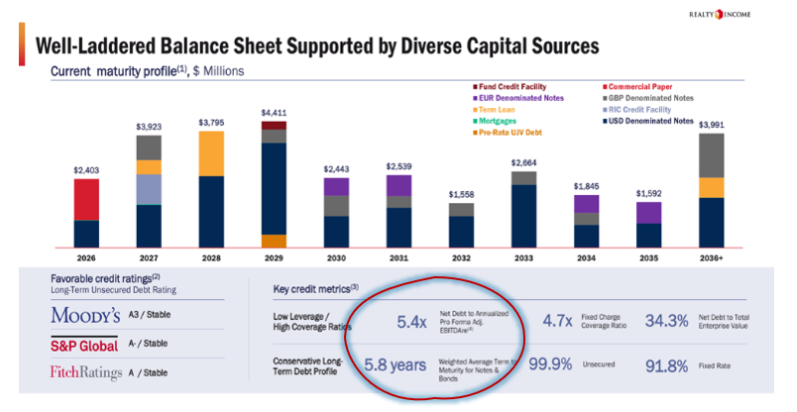
Realty Income’s Weighted Average Score: 5.8 years. Having an average maturity of nearly 6 years means that the vast majority of their debt is locked up for the long haul. Realty Income is heavily insulated against short-term interest rate spikes because they do not have a massive block of old debt instantly expiring and needing to be refinanced at today's higher rates.
There are several other metrics that investors use to analyze REITs further, but for a beginner, the above are more than enough to grasp and begin their REIT investing journey.
With this, I’ll end this week’s Byte.
I know this was a lot of information, but don’t let the numbers and terminology intimidate you. Investing in REITs becomes much easier once you understand what a REIT does and know which numbers to focus on. When you do, you can start looking beyond the dividend and really understand the business behind it.
And that’s the goal - not to become a real estate expert overnight, but to become a more confident investor, one step at a time.
Take your time absorbing this - you’ve got this!
If you remember only one thing from this Byte, remember this: don't buy a REIT simply because it has a high dividend. Look at the business, the cash available to support that dividend, the debt behind the business, and the price you're paying for it.
I hope you found this Byte meaningful and, more importantly, useful. I’d love to hear your thoughts, questions, or even which REIT you’re researching. And if you enjoyed this Byte, don’t forget to share it and subscribe :)
Your friend in investing,
Pooja
P.S. Next week, I’ll be taking a small break to enjoy the tail-end of summer. I’ll see you in September!
