🌏Byte # 56: Why Emerging Markets Deserve a Spot in Your Portfolio
Dear Readers,
Today, let’s revisit a simple but powerful idea: diversification that actually moves the needle. One of the most effective satellite allocations for long‑term investors is emerging markets (EM) - a segment many have written off over the last decade as the S&P 500 dominated global returns. But what if that very dominance is the reason EM deserves another look today?
Two of my favorite ways to access EM are the iShares Core MSCI Emerging Markets ETF (IEMG) and the Avantis Emerging Markets Equity ETF (AVEM). Both offer broad exposure, but with very different philosophies: IEMG provides pure, low‑cost, market‑cap‑weighted EM exposure, while AVEM adds systematic tilts toward value, profitability, and small caps. Importantly, both ETFs draw heavily from the same core countries - China, Taiwan, India, South Korea, and Brazil - giving you access to the economic engines driving global growth.
EM economies are home to the world’s fastest growth, expanding middle classes, and powerful long‑term structural tailwinds. Yes, they come with political and currency risks - but the right ETFs help you capture the upside while managing the complexity.
You may also be wondering about Vanguard’s Emerging Markets ETF (VWO), one of the largest EM funds globally. I didn’t include it here for a simple reason: VWO excludes South Korea, a major EM growth contributor, and its portfolio tilts more heavily toward China, Taiwan, and India. That country mix has been a key driver of its relative underperformance versus IEMG and AVEM in recent years. It’s still a solid fund - just not the best fit for the comparison I’m making today. The reason for its exclusion is structural: VWO tracks the FTSE Emerging Markets Index, and FTSE classifies South Korea as a developed market, not an emerging one. By contrast, IEMG tracks the MSCI Emerging Markets Index, and MSCI continues to classify South Korea as an emerging market, which is why IEMG and AVEM include Korean giants like Samsung and SK Hynix.
📊 AVEM vs IEMG vs IVV (S&P 500): Performance, Valuation & Forward Metrics
Here’s a clean snapshot to help you compare EM ETFs against the S&P 500 ETF IVV:
(All trailing performance as of May 31, 2026
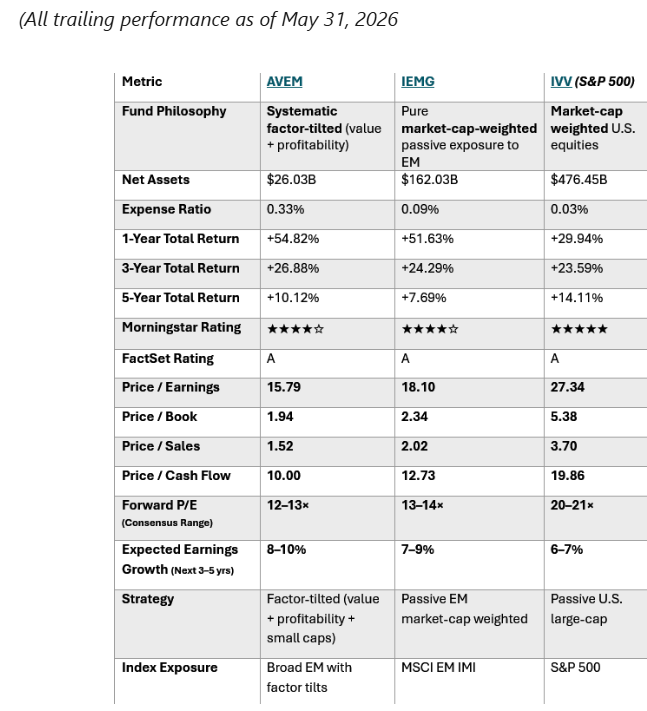
🧠What this table tells you
EM crushed the S&P 500 over the last year - AVEM +54.82% and IEMG +51.63% vs IVV +29.94%.
Over 3 years, all three are neck‑and‑neck - A reminder that EM cycles are volatile - but powerful.
Over 5 years, the S&P 500 still leads - Long‑term U.S. dominance remains intact.
AVEM consistently outperforms IEMG - Factor tilts (value + profitability + small caps) are doing their job.
🚫 A Quick Note on Exclusions: VWO and EEM
While there are many ways to access emerging markets, two widely held ETFs - VWO and EEM - are intentionally not part of today’s comparison.
VWO (Vanguard Emerging Markets ETF) VWO has been a long‑standing EM favorite, but it excludes South Korea, a major EM growth engine, because it tracks the FTSE Emerging Markets Index, which classifies Korea as a developed market. By contrast, IEMG and AVEM track the MSCI Emerging Markets Index, and MSCI continues to classify South Korea as an emerging market - which is why both funds include Korean giants like Samsung and SK Hynix. VWO is still a solid fund - just not the best fit for the comparison I’m making today.
EEM (iShares MSCI Emerging Markets ETF) EEM tracks the same MSCI EM universe as both IEMG and AVEM and historically has delivered similar returns. However, it comes with a much higher expense ratio (0.72%), which makes it significantly less efficient for long‑term investors. Since IEMG offers nearly identical exposure at a fraction of the cost, and AVEM provides a lower‑cost, factor‑tilted approach with strongerperformance, EEM simply isn’t as compelling for this comparison.
🌏 Why EM Belongs in Portfolios Today
Emerging markets are entering one of their strongest setups in years. 2026 GDP growth is projected at 3.9%, more than double developed markets at 1.8%. Both AVEM and IEMG hold global leaders like Taiwan Semiconductor, Samsung, SK Hynix, Tencent, and Alibaba, giving you exposure to the sectors driving global growth - technology, financials, and consumer discretionary.
Since early 2025, EM has outperformed the S&P 500, and valuations remain deeply compelling. EM trades at a ~35% discount to U.S. equities, supported by lower P/E, P/B, P/S, and P/CF ratios across the board. Add in structural tailwinds - younger demographics, rapid urbanization, and rising household wealth - and EM offers a rare combination of higher growth, cheaper valuations, and broad exposure to the companies shaping the next decade.
🎯 Final Thoughts
That’s it for today, my friends. This framework isn’t complicated - it’s simply about using the right metrics to stress‑test your thesis and stay disciplined in your process. You can apply the same lens when comparing any ETF, and if there are other metrics you rely on, I’d love to hear which ones you find most useful.
Keep investing smarter 😊
Cheers,
Pooja
